
My Stream Deck has four Stable Diffusion buttons now: 1x through 4x, one WebUI instance per button, all sharing a single laptop GPU. Last night I finally put that ladder on the bench for real. Identical payloads, telemetry every two seconds, a cooldown gate between waves, the whole shebang.
I expected a space heater, the kind I could make flapjacks on. The data laughed at me. You know the Nelson Muntz kind of laugh that told me I wasn’t getting my flapjacks anytime soon.
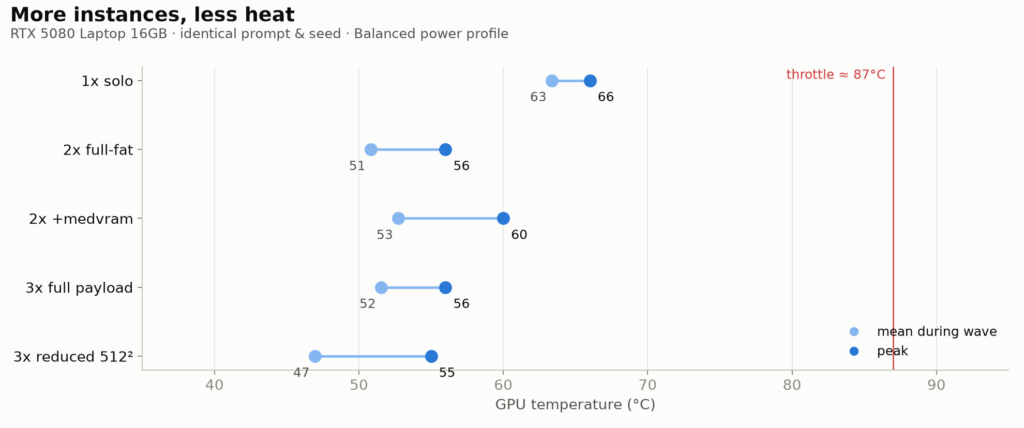
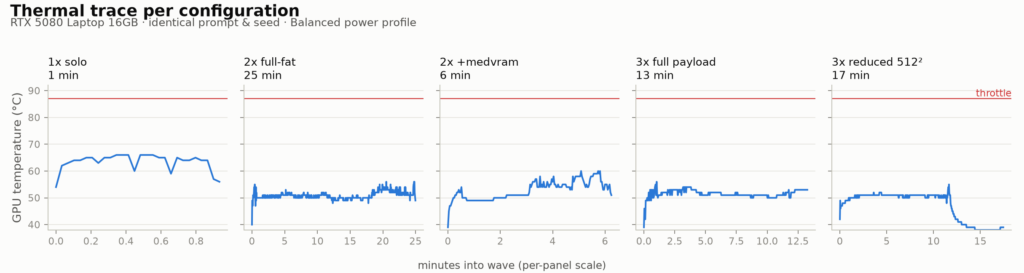
The hottest configuration of the entire bench was one instance running alone, at 66C, that’s just under 151F for us edumacated americanos who maybe reading these fancy book words.
Every instance I stacked on top made the card run cooler. The three-instance wave that killed one of its own streams averaged 47C(116.6F), seven degrees below what this laptop sits at doing nothing.
The card was not working harder as I stacked. It was waiting in line. Just like a teenager at a my chemical romance concert. (Haha, I’m old, isn’t that weird?) Contention converts compute time into memory-wait time, and waiting on memory is thermally almost free. That one sentence is the whole bench. The rest of this post is the receipts.
The rig and the rules
The bench: an MSI Stealth 18 HX AI A2 XW Alphabet Numbers BBQ Low Fat Combo with an RTX 5080 Laptop GPU, 16GB of VRAM, a 150W power limit, and a throttle point around 87C(188.6F). Balanced power scheme, no Windows power overlay, on AC. The software is A1111 WebUI v1.10.1 in a multi-instance setup: tiered launcher buttons, per-instance data folders, and one shared model library wired through NTFS junctions so three instances do not mean three copies of every checkpoint. Instance one runs full-fat on port 7860. Instance two lives on 7861. Instance three runs on 7862 with --medvram. Instance four exists, has a button, and stayed dark all night. More on that at the end.
Every wave fired the same payload at every participating instance simultaneously over the API: 35 steps, Euler a with the Karras scheduler, CFG 5, Clip Skip 2, seed 20260723, 896×1152, four images per instance, plain txt2img. No hires fix, no ADetailer. The exact prompt pair is printed beside the renders near the end. A collector script sampled nvidia-smi and each instance’s progress endpoint every two seconds, and a cooldown gate held each wave until the GPU sat at 55C(131F). This laptop idles around 54C(129.2F). The gate was not generous.
Between waves I unloaded and reloaded the checkpoint on every instance, so no wave inherited the last one’s memory state.
I also had a sandwich. It was delicious. Thank you for asking.
The checkpoint hunt became a story of its own, one involving an epic descent into the depths of the
internet and copious amounts of eye bleach. I settled on Illustrious XL v1.1, the official OnomaAI release, as the
test model. Mostly because it is citable and entirely safe for work… unlike 90% of other Illustrious forks. Out of the box it drew like exactly what it is, an Illustrious checkpoint, which is to say that even fully
SFW prompts came back ‘SFW and unfortunate.’ Half the trap is the Civitai page itself, whose example gallery leans
heavily toward the unfortunate. Lesson learned: Hugging Face next time. Quality tags helped. CLIP skip 2 helped too, once I noticed the GUI had silently ignored the setting and I pushed it over the API instead, verified this time. Still not enough, and I was out of eye bleach. I flirted with the WAI-Realism fork, then landed on Illus-SAT-Comix (IlluSat-ComixV4, Civitai model 1803473), an Illustrious-family finetune with a comic aesthetic and completely standard sampling. A DMD-distilled sibling got ruled out on purpose; distilled checkpoints render in 4 to 8 steps at CFG around 1, great for speed, useless for a thermal bench. A render that short never soaks the card.
The ladder
| Config | s/image per stream | Peak / mean temp | Peak / mean power | VRAM idle to peak | Outcome |
|---|---|---|---|---|---|
| 1x solo | 14.1 | 66C / 63C | 110W / 98W | 7.7 to 11.7 GB | Clean |
| 2x full-fat | 364.0 and 375.0 | 56C / 51C | 117W / 62W | 14.8 to 15.5 GB | Finished, ~26x per-stream collapse |
| 2x with medvram | 93.8 and 92.9 | 60C / 53C | 141W / 71W | 9.3 to 15.4 GB | Clean, ~6.6x per-stream cost |
| 3x full payload | first images 47s and 214s, i3 none | 56C / 52C | 130W / 56W | 7.8 to 15.3 GB | Gridlock, aborted at ~13 min |
| 3x reduced, 512×512, 2 images | 156.7 and 353.8, i2 dead | 55C / 47C | 105W / 43W | 7.7 to 15.5 GB | All 3 delivered, i2 died doing it |
Tier 1 is the control: 14.1 seconds per image, 66C(150.8F) degrees peak, 98 watts average, done inside a minute. Busy, warm, healthy. Remember that 14.1. Every other number tonight gets measured against it.
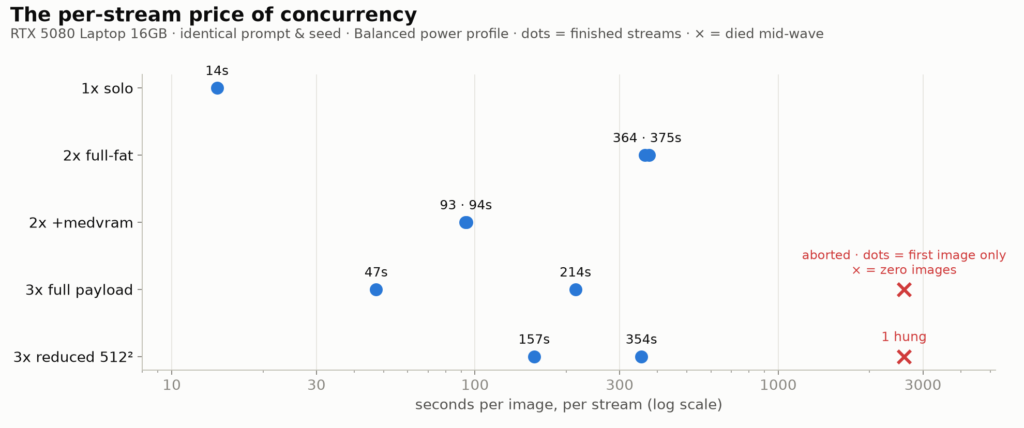
Tier 2, the naive version, is what happens when you trust luck instead of arithmetic. Two full-fat SDXL instances idle at 14.8GB combined. The card has 16. That is less headroom than a Bethesda inventory at the weight cap. The wave technically finished, every image delivered, but each stream paid 364.0 and 375.0 seconds per image, roughly 26 times the solo price, while the driver quietly shoveled tensors between VRAM and system RAM the entire time.
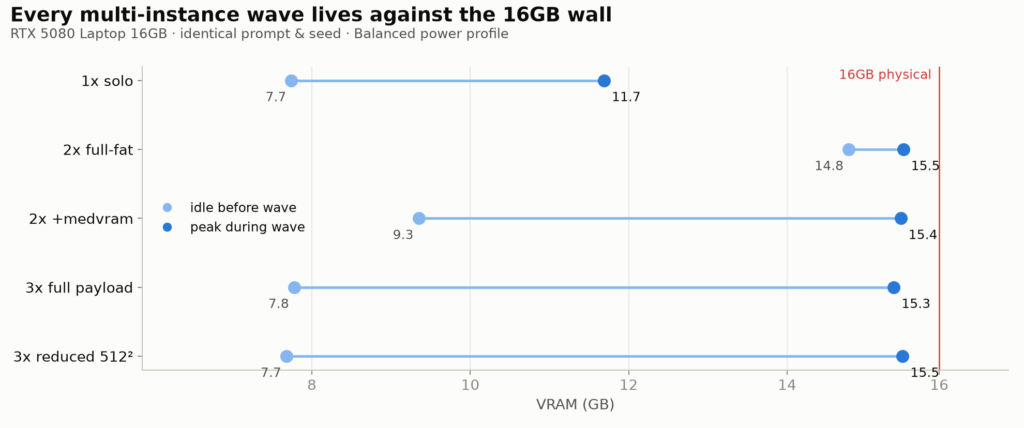
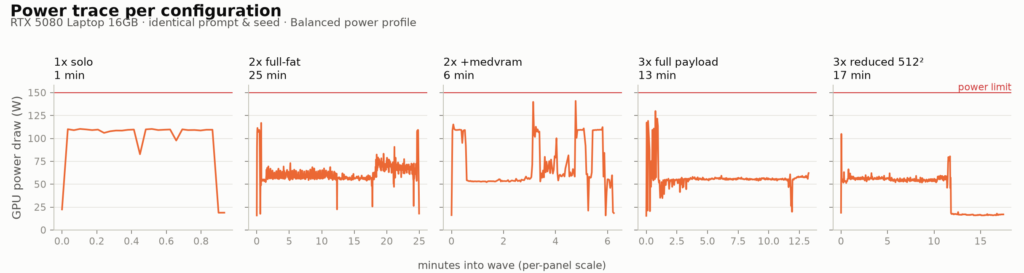
The fix was one flag. Giving i2(2x Instances) --medvram drops the pair’s idle footprint to 9.3GB, and the same wave completes clean at 93.8 and 92.9 seconds per image, call it 6.6x. Still a real tax. But it is a planned tax: medvram offloads model parts on a schedule instead of letting the driver panic-spill at random. Planned offload is slower and stable. Unplanned spill is slower and cursed. Cursed? Like being up at 3AM writing an article about generating anime women? Hold that thought for tier 3. And note the power: the medvram pair peaked at 141 watts, the highest of the whole bench, because both instances were actually computing instead of waiting.
Tier 3 at full payload is where the wheels came off. i1(1x Instances) delivered its first image in 47 seconds. i2 took 214. i3(3x Instances) never delivered one. Thirteen minutes in, I pulled the plug, and even the abort ran in slow motion. An interrupt only bites at a step boundary, and under gridlock a single step takes minutes. So the instances took 111 to 177 seconds of wall clock to come to rest after I pressed stop. Under that gridlock, i2’s second image needed 243 seconds to complete its first sampling step, then 73 and 115 for the next two. i3 once took about seven minutes to advance a single step. Two instances still walked away with two finished images each. i3 got nothing.
One hundred percent busy, nobody moving
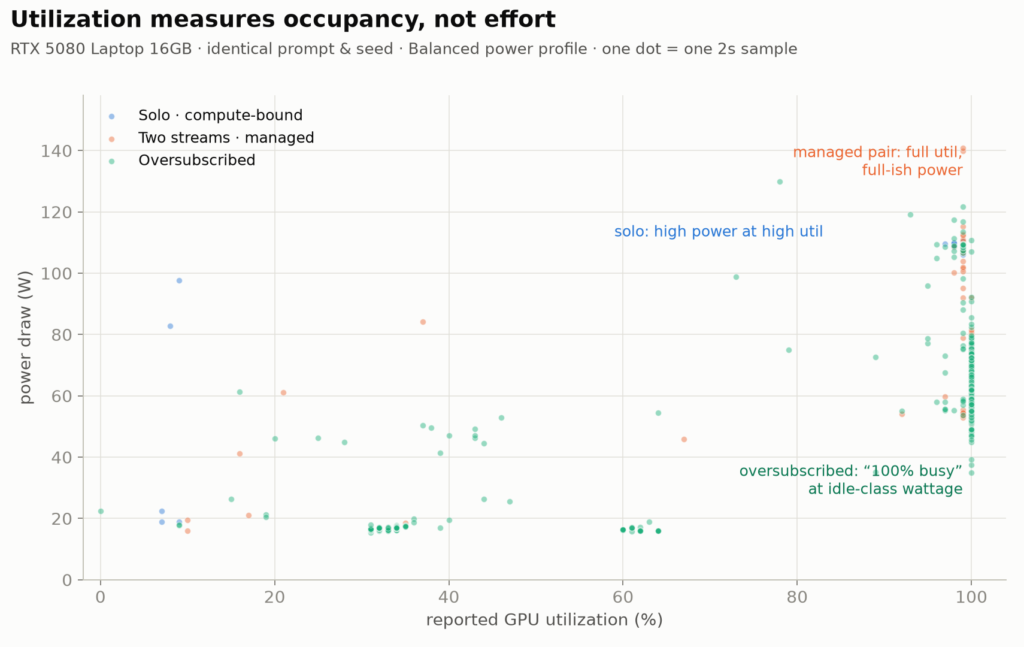
The exhibit of the night sits in the middle of that aborted wave. For a full minute, starting about three and a half minutes in, all three instances sat at step 0. Progress pinned at 26, 26, and 1 percent. Nobody moved. And the GPU reported 97 to 100 percent utilization the entire time, at about 56 watts and 53C(127.4F) degrees.
A hundred percent busy. Zero steps of work. Much like a vibe coder. The utilization gauge is not lying, exactly. It measures whether work is resident on the GPU, not whether the work is going anywhere.
This was occupancy, not effort. Your college roommate’s entire business model. The gap ran across the
whole bench: 1,530 two-second samples reported utilization of 97 percent or higher. During those same samples, actual
power draw spanned 34.9 to 140.9 watts. Same gauge reading, four times the effort. Temperature follows power the way
it should: across all 1,747 wave samples, power and temperature correlate at r = 0.80. Power follows arithmetic.
Temperature follows power. Utilization follows nothing you should trust. Also like your college roommate.
Three identical jobs, three fates
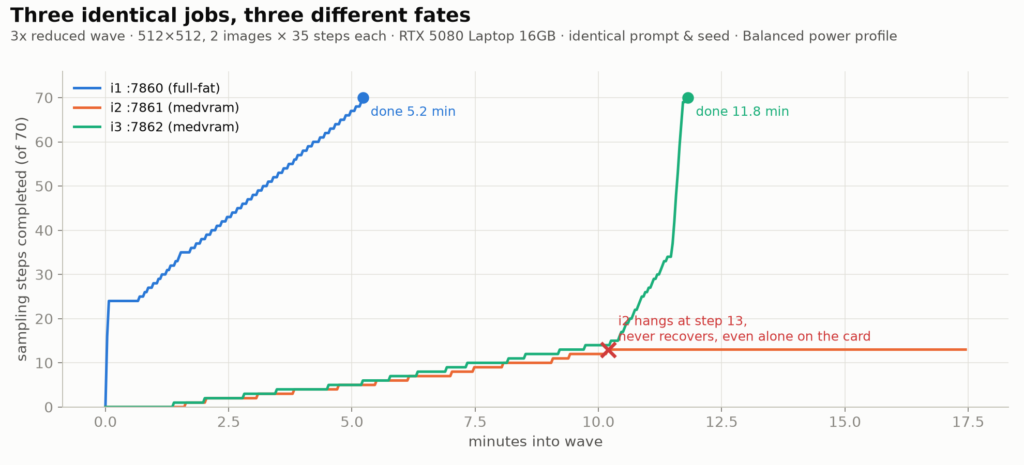
For the tier 3 rerun I retreated to 512×512, two images per instance. That is half this architecture’s native resolution, and the renders pay a visible quality tax for it. It was the price of making tier 3 complete at all.
Three identical jobs. Three different endings.
i1 ran fastest, 156.7 seconds per image, done at 5.2 minutes. i3 crawled from the start, one sampling step every 38 to 83 seconds while all three shared the card, improving only slightly after i1 left. Then, at 10.2 minutes, i2 stopped advancing. Within about fifteen seconds of i2’s last step, i3 took off: two to four seconds per step, its entire second image in about twenty seconds, finished at 11.8 minutes and 353.8 seconds per image.
Here is the kicker that makes it interesting: nvidia-smi’s memory number never moved. Around 14.3GB allocated before the leap, during it, and after it. Allocation is not residency. My read, and I flag it as a read: once i2 stopped touching its own spilled memory, i3’s working set finally won the residency race and came home to VRAM. There is no gauge that shows residency directly. The step cadence is the only witness.
And i2?
Dead. Wedged at step 13 of its second image at ten minutes eleven seconds in, and it never advanced again. Not while i3 hammered the card, and not in the five-plus minutes after i3 finished, when i2 had the entire GPU to itself. Its power tail sat around 16 watts, idle-class wattage, at a reported 31 to 64 percent utilization. The collector’s API call died with WinError 10054. The interrupt flag was set and never honored. No driver event, no crash dialog, just a userspace CUDA hang wearing a progress bar. I killed the process myself.
And then I opened its outputs folder. Both of its images were there. The first, saved clean, from back when i2 was still answering its API calls. The second, flushed to disk by the kill itself, frozen at step-13 quality, much, much, much closer to fog than to art. But it exists, sitting right next to its finished sibling. The instance died. The work shipped anyway.
Slow or dead?
Twice in one night the bench produced the same picture: a fleet that looks frozen, a gauge that says busy, nothing apparently arriving. NVIDIA documents exactly this scenario, generation that appears hung because the driver quietly fell back from VRAM to system memory under pressure (KB a_id/5490, in the sidebar below). The KB says roughly 10x slower than expected. i3 paid roughly 25x against the solo baseline. The KB undersold my evening.
But only one of the two freezes was real. The full-payload gridlock looked dead and was actually crawling, and two instances delivered finished images in the middle of it. The i2 hang looked identical from the outside and was actually dead. Same console, same vibe, opposite verdicts. You cannot tell them apart by staring at the progress bar, because the progress bar is the thing that is broken.
You tell them apart with three questions. Is the step counter advancing at all, measured over minutes, not seconds? Is power draw above idle? Does an interrupt ever bite? Slow answers yes to at least the first two. Dead answers no to all three. The gridlocked wave: steps advanced, glacially, power sat above idle, and the interrupt did eventually bite. Slow. Let it cook or wind it down, your call, but it is alive. i2: zero steps over seven-plus minutes, 16 watts with the card otherwise free, interrupt ignored. Dead. Kill it on three noes, and only on three noes.
One more reading the test cannot give you: what the dead leave behind. i2 earned its three noes and killing it was correct. Its outputs folder disagreed with the obituary anyway: both images present, the second exactly as far along as the sampler got before the lights went out. Quality is a separate axis from delivery. The night’s final score, then: one wave filed as failed by its own orchestrator, and every instance’s pair on disk. i1’s on time, i3’s fashionably late, i2’s posthumous, one of them half fog. Dead process, delivered work.
Side Hustle: Thirty “failures” that shipped real images
That test exists because the reporting layer lies constantly, and not just to me. I collected 30 public reports (GitHub issues and one NVIDIA KB entry) of Stable Diffusion “failures” that still produced finished images. They sort into six buckets:
- Client-server channel failures (timeouts, disconnects, gateway/proxy errors), 8 findings (#9384, #9136, discussions/9223, discussions/8476, #10573, discussions/1487, #16349, #12952). The connection between client and server drops or times out while the backend keeps rendering and writes the result to disk regardless of what the client saw.
- Gradio/UI display and progress-reporting failures, 11 findings (#160, #6237, #8309, #8904, #13199, #11879, #12953, #8813, #7928, discussions/6271, #10901). The biggest bucket: the UI thread, live preview, or progress bar fails, sometimes with its own error, while the generation loop underneath finishes normally.
- VAE NaN auto-recovery, 2 findings (#7633, #17126). A “NansException” fires mid-decode, webui upcasts the VAE to fp32 and retries on its own, and a valid image comes out. The error message is a log of a handled condition.
- Batch partial-delivery, 3 findings (#15707, #7533, #14841). A batch renders completely, and the UI or API shows only part of it.
- Save-path / proxy serving errors, 2 findings (#2730, #15755). The error fires between “image written” and “image served”: a WinError 123 during save handling or a reverse-proxy 404, with the file already sitting on disk.
- Interrupt, crash, and driver-stall resilience, 4 findings (#9082, NVIDIA KB a_id/5490, #5277, #1033). A signal that reads as “the job stopped” does not erase the work: per-image saves are already committed, or the process is simply still running past the point everyone assumed it died.
A few exemplars, because they are almost funny. The NVIDIA sysmem fallback (https://nvidia.custhelp.com/app/answers/detail/a_id/5490): generation “frozen,” actually just slow, completes fine. The VAE NaN recovery (https://github.com/AUTOMATIC1111/stable-diffusion-webui/issues/7633): a scary all-NaNs exception that the fallback path fixed automatically. The 524 timeout (https://github.com/AUTOMATIC1111/stable-diffusion-webui/issues/9384): the client gave up, the server finished and saved anyway. The interrupt-still-saves report (https://github.com/AUTOMATIC1111/stable-diffusion-webui/issues/5277), filed as a feature request to NOT save on interrupt, because canceled jobs kept producing files. And the display failure (https://github.com/AUTOMATIC1111/stable-diffusion-webui/issues/8904): UI shows an error state, file already written under outputs.
Across all 30, the thing that fails and the thing that matters live on different layers. A timeout, a dark socket, a blank progress bar, a proxy 404, an interrupt signal: each describes the state of a reporting channel, not the state of the work. The generation loop, the VAE decode, and the per-image save routine run largely independent of whatever is watching them. My own bench did it to me the same night: the orchestrator reported the 3x reduced wave as failed when its call to i2 died, and two of the three instances had already delivered completed images to disk. My field notes agree. Cancel hires.fix in its second half and you always get an image, because the base pass is already complete. A hard crash keeps every per-image save made before the crash and loses only the in-flight image. An error message is a hypothesis, not a verdict. The only claim actually about the work is what exists in the outputs folder afterward. Verify at the artifact layer, because everything upstream of the file on disk has been shown, thirty times over, to lie. Thirty-one, counting i2.
The renders
Numbers argue, pictures settle. One render from each tier, all from the same positive prompt, each the second image of its batch, which makes them all effective seed 20260724:
masterpiece, best quality, 1girl, red hair, casual clothes, sitting, bus stop, rain



The conductor
So what actually failed last night? Not the silicon. The card kept a 21-degree thermal margin at its absolute worst, never touched its power limit in any concurrent wave, and delivered finished images in the middle of a gridlock. What failed was arbitration. Three processes made synchronized, identical demands on one memory pool, and nobody was in charge of the queue.
Windows exposes no per-process VRAM priority, so residency cannot be commanded. Dispatch can. The next build on this rig is a conductor: a process that deals images one at a time to each instance like hands at a card table, holds the queue for laggards at image boundaries (where memory naturally reshuffles), refuses combinations whose resident sets cannot fit, and unloads a finished instance’s checkpoint to gift its VRAM to the stragglers. Every piece of that drives through the same public API the bench already used. Twenty-plus years of GMing taught me the same rule at the table: nobody acts twice before everyone has acted once.
The design goal is deliberate phase offset, not lockstep. Synchronized identical jobs are the pathological case, three workloads hitting the same memory wall on the same tick. Organic, staggered work is why my earlier multi-instance days felt fine. The bench did not discover that multi-instance is broken. It discovered that synchronized multi-instance is the worst case, measured it, and priced the tiers: VRAM-resident is fast, planned offload is slower but stable, unplanned spill is gridlock. One flag turning tier 2 from a 26x collapse into a 6.6x tax is the planned-offload tier proving itself.
And tier 4? The button exists. Built, tested on an easier day, sitting right there on the Stream Deck. It stayed dark through the whole bench, because at this payload class, on this hardware, four instances is not viable. That is not a defeat. That is a measurement. The ladder ends at three, the conductor gets built next, and the card, for the record, never once broke a sweat.
That job stayed with me. yaaaay…